
You just had a hearing test. The audiologist hands you a printout covered in Os, Xs, and a graph that looks like a stock chart after bad news. They explain it quickly, you nod, and by the parking lot you have forgotten half of it.
This guide fixes that. In ten minutes you will be able to read your audiogram yourself: what the axes mean, what the symbols say, and what your pattern means for treatment.
The Two Axes: Pitch and Volume
An audiogram is a graph with two measurements:
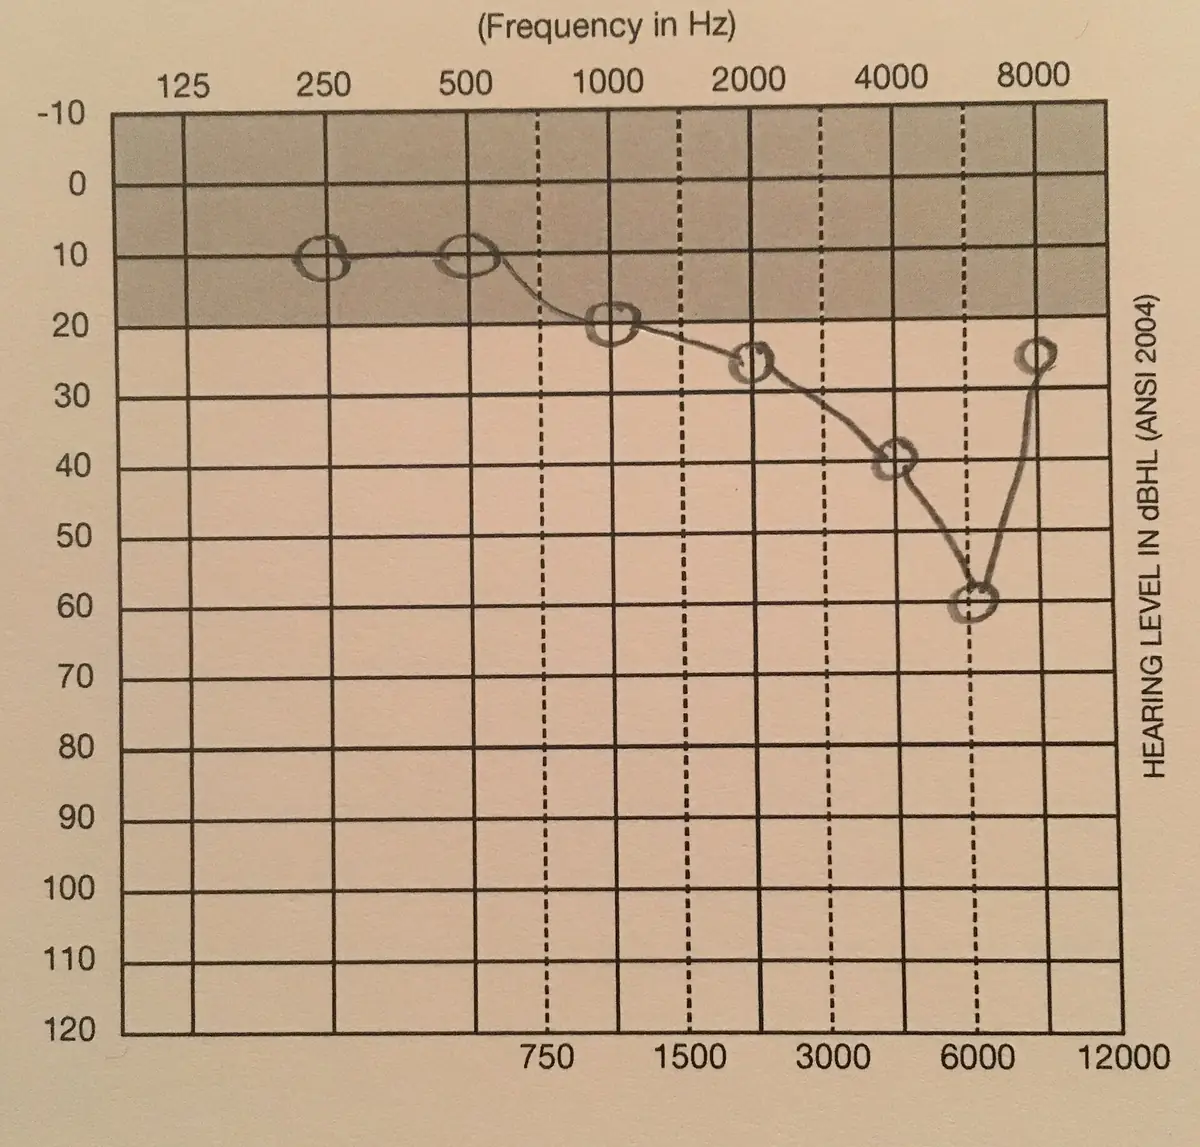
- Across the top (horizontal axis): frequency, or pitch, measured in Hertz (Hz). Low pitches (a bass drum, a man’s deep voice) sit on the left around 250 Hz. High pitches (birds chirping, children’s voices, the consonants s and f) sit on the right up to 8000 Hz. Human speech mostly lives between 250 and 8000 Hz, which is why the test focuses there.
- Down the side (vertical axis): hearing level, measured in decibels (dB HL). Here is the counterintuitive part: zero is at the top, and numbers increase downward (10, 20, 30… up to 120). Zero does not mean silence; it means the average hearing of a healthy young adult. Marks near the top are good. Marks sinking toward the bottom mean you need sounds louder to hear them, which is hearing loss.
During the test, you raised your hand (or pressed a button) for the softest tone you could hear at each pitch. Each mark on the graph is that threshold: the quietest sound you detected.
The Symbols: O, X, and Brackets
| Symbol | Meaning |
|---|---|
| O (usually red) | Right ear, air conduction (sound through headphones/speakers) |
| X (usually blue) | Left ear, air conduction |
| < and > | Bone conduction: sound vibrated directly through the skull, bypassing outer/middle ear |
| S or A | Aided results (with hearing aids) or soundfield testing |
The bone conduction brackets are diagnostically important: if bone conduction scores much better than air conduction, the problem is conductive (outer/middle ear); if both are equally poor, it is sensorineural. That gap is exactly how your provider identifies your type of hearing loss.
Reading the Shape of Your Loss
Connect the marks for each ear and you get a line showing your hearing across pitches. Common patterns:
- Sloping down to the right: the classic age-related pattern. Good low-pitch hearing, declining high pitches. You hear vowels fine but miss consonants, so speech sounds mumbled. This is the most common adult pattern.
- Flat across: similar loss at all pitches. Often seen with certain genetic or congenital conditions.
- Cookie bite (U-shape): mid-pitches worse than lows and highs. Less common, often hereditary.
- One ear much worse: asymmetric loss, which always deserves medical investigation to rule out treatable causes.
- Normal through 2000 Hz then dropping: early noise-induced loss, the “noise notch” around 4000 Hz is the fingerprint of loud exposure.
The Speech Banana
Many audiograms overlay a banana-shaped shaded region called the speech banana. It maps where the sounds of human speech fall on the graph: vowels (a, e, o) cluster low-left, consonants (s, sh, f, th) cluster high-right. If your marks fall inside the banana, you hear those speech sounds; where your line dips below it, those sounds are inaudible to you.
This is why two people with the “same” average loss hear differently. A line dipping below the banana’s high-frequency tip means missing exactly the consonants that make speech clear, which explains the classic complaint: “I hear you talking, I just cannot understand you.”
What the Numbers Mean: Degrees of Loss
Audiologists average your thresholds at key speech frequencies (usually 500, 1000, 2000, and 4000 Hz) and grade the result:
- Normal: -10 to 25 dB. No meaningful loss.
- Mild: 26 to 40 dB. Soft speech and whispers get missed; trouble in noise begins.
- Moderate: 41 to 55 dB. Regular conversation needs extra volume; this is where most first-time aid buyers land.
- Moderately severe: 56 to 70 dB. Loud speech needed; hearing aids strongly recommended.
- Severe: 71 to 90 dB. Only very loud sounds heard; powerful prescription aids required.
- Profound: 91+ dB. Very little hearing even with amplification; cochlear implant evaluation may be appropriate.
These thresholds also answer the OTC question directly: OTC hearing aids are designed for mild to moderate loss (up to about 55 dB). Beyond that, you need prescription power. If your average sits at 60 dB, no OTC device will cut it, no matter the marketing.
is where “mild” loss begins, and it already affects real life: missed soft consonants, difficulty in restaurants, and the TV volume creeping up that families notice first.
What to Ask About Your Results
At your appointment (or when reviewing a printout), ask:
- What is my degree of loss in each ear, in plain words?
- Is the pattern symmetric, and if not, what should we rule out?
- Is there an air-bone gap suggesting a conductive component?
- Am I a candidate for OTC devices, or do I need prescription fitting?
- How often should I retest? (Typically every 1 to 3 years, or sooner if things change.)
Bring these answers to any purchase decision. Our 15 questions to ask before buying hearing aids builds on them, and 2026 pricing helps you budget once you know what tier you need.
Using Your Audiogram With OTC Devices
Here is a practical trick many buyers miss: your professional audiogram makes self-fitting dramatically better. Several leading OTC apps (including Jabra Enhance and Lexie) let you enter your audiogram values manually instead of relying on their in-app hearing check. The result is a self-fitted device tuned to clinical data, a genuine hybrid of the two worlds.
To do it, you need your thresholds at 500, 1000, 2000, and 4000 Hz for each ear, exactly the numbers your audiogram shows. Enter them carefully; a typo at one frequency skews the whole prescription. If the app only offers its own hearing test, take it in the quietest room you have, with good earbuds, and no interruptions. Background noise during the test produces a worse “audiogram” than you really have, and the device will over-amplify.
One caution: an audiogram is a snapshot, not a permanent record. If yours is more than a year or two old, or if your hearing has changed since, retest before using old numbers to program new devices. And remember the boundary: if your thresholds average beyond moderate (above roughly 55 dB), no amount of clever app entry makes an OTC device the right tool. That is prescription territory, as our OTC vs prescription guide explains.
Frequently Asked Questions
Can I get an audiogram online?
Online hearing screenings give a rough estimate, useful as a first check. But a diagnostic audiogram requires calibrated equipment and a sound-treated booth; phone speakers and earbuds cannot match that accuracy. Use online tests for screening, professional tests for decisions.
Why does my audiogram look fine but I still struggle to hear?
A few possibilities: auditory processing disorder (normal thresholds, poor understanding, especially in noise), early high-frequency loss above 8000 Hz that standard tests skip, or fluctuating loss. If the graph says “normal” and life says otherwise, ask about extended high-frequency testing and processing evaluation.
How often do audiograms change?
Age-related loss typically progresses slowly, a few decibels per year. Noise damage, illness, or ototoxic medications can shift it faster. Retest every few years after 50, annually if you wear aids (so programming stays matched), and promptly after any sudden change.
Should I keep a copy of my audiogram?
Yes. It is your hearing’s medical record: useful for second opinions, tracking progression, programming new aids, and even OTC setup (some apps let you enter audiogram values for more precise self-fitting).
Tracking Changes Over Time
Your first audiogram is valuable; your second one is illuminating. Comparing graphs across years shows whether your loss is stable, creeping, or suddenly shifting, and each pattern means something different. Slow, symmetric decline is typical aging. A sudden drop in one ear deserves prompt medical attention, not a routine retest next year.
Keep every audiogram you receive, with dates. When you eventually buy hearing aids, the provider programs them from your most recent test, and having the history helps distinguish long-standing loss from new changes. If you wear aids already, annual retests keep the programming matched to your current hearing rather than last year’s.
The Bottom Line
Your audiogram is not a secret code; it is a map of your hearing across pitch and volume. Learn to read the axes, the symbols, and the shape, and you will walk into every appointment as an informed partner rather than a passive patient. If you have not been tested yet and recognize the early signs of hearing loss, book the test. The graph takes thirty minutes; the clarity lasts years.